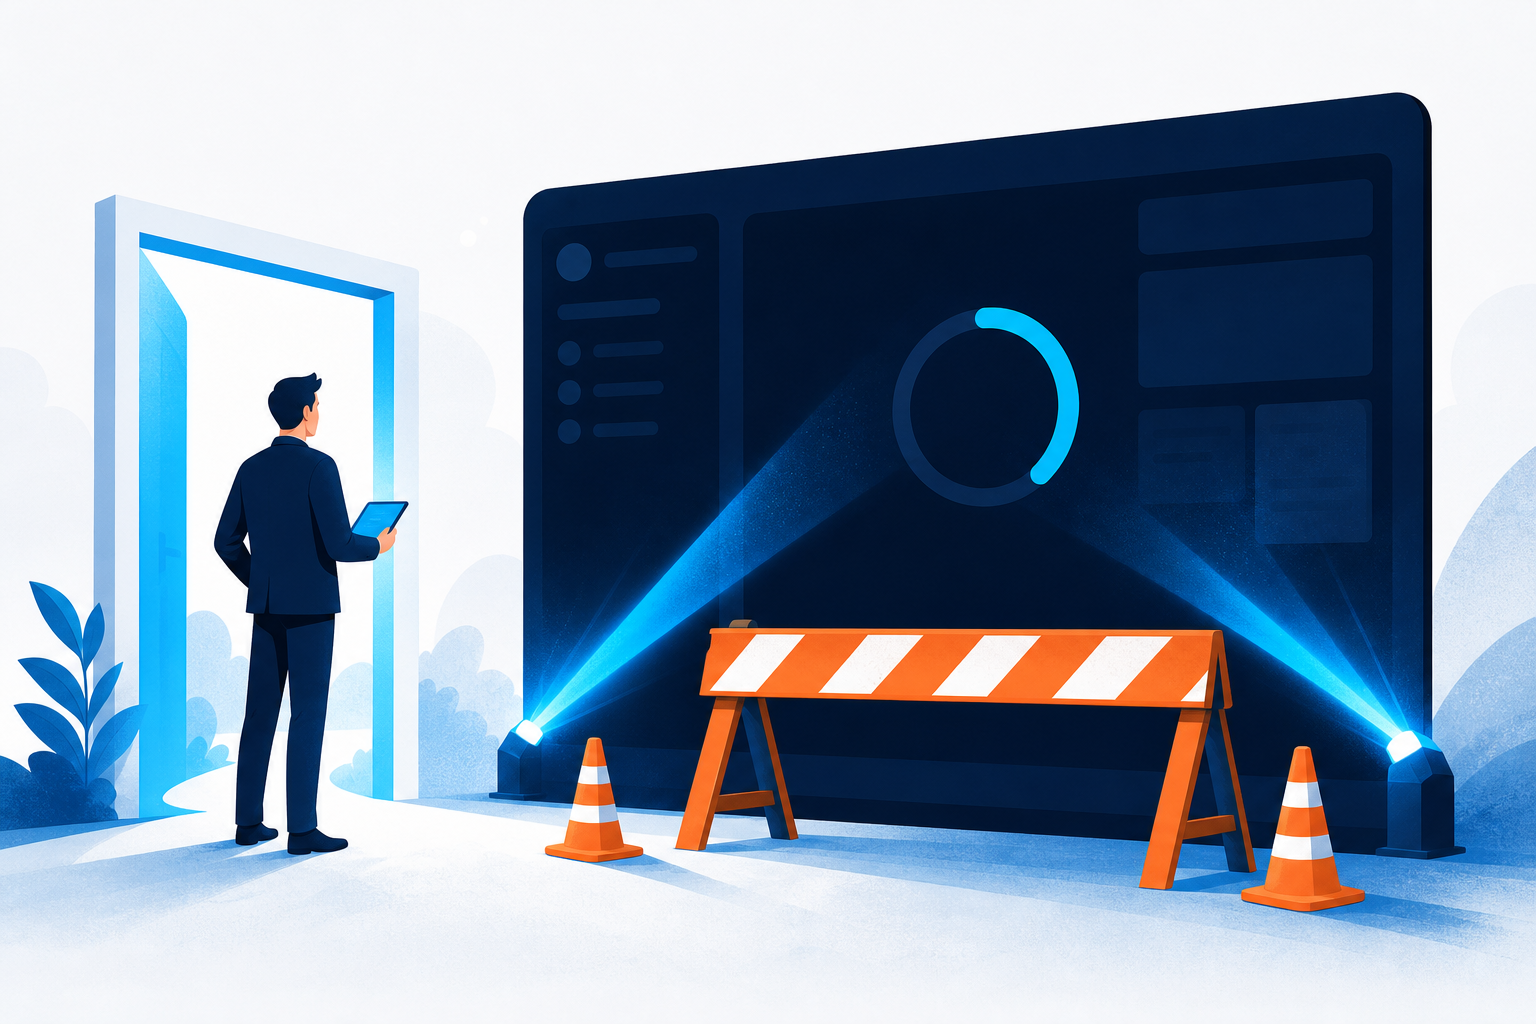

If your WordPress dashboard is not loading after you sign in, do not immediately edit wp-config.php or reinstall WordPress. First identify what you see: a blank page, an endless spinner, a timeout, a 403/500 error, or a dashboard that loads without its menus and widgets. Each symptom points to a different cause.
In this guide
This guide starts with safe browser and cache checks, then moves through plugin isolation, PHP error logging, server limits, and database or hosting checks. Make a backup or create a hosting snapshot before changing files, plugins, or database settings on a production site.
Identify what “not loading” means
Open the login page in a private browser window and sign in again. Record the exact result rather than relying on a general description.
- Blank white page: often a PHP fatal error, exhausted memory, or incompatible plugin or theme.
- Endless loading indicator: commonly a JavaScript error, blocked REST request, slow server response, or plugin conflict.
- 500 or 503 response: usually a PHP, server-resource, maintenance, or hosting problem.
- 403 or access denied: commonly a firewall, security rule, permissions issue, or host restriction.
- Dashboard shell appears but content is missing: inspect the browser console and failed network requests; the page may be failing after its initial HTML loads.
- Only one administrator account is affected: test another administrator or a private window before changing site files.
Also test the public site. If both the front end and /wp-admin/ fail, investigate hosting, PHP, database, or malware before focusing only on the dashboard.
1. Rule out a browser, session, and cache problem
These checks are safe and take only a few minutes.
- Open
https://example.com/wp-admin/in a private or incognito window. - Try a different browser or device on the same network.
- Temporarily disable browser extensions, especially ad blockers, script blockers, privacy tools, and password managers.
- Clear cookies and cached files for the site, then sign in again.
- Check whether the problem affects every administrator or only your account.
If the dashboard works privately but not in your normal browser, the site is probably healthy. Re-enable extensions one at a time and remove the stale site cookies rather than changing WordPress files.
2. Check whether a plugin or theme caused the failure
A recent update, newly activated plugin, security rule, optimization setting, or theme change is a strong clue. If you can reach Plugins, deactivate recently changed plugins one at a time and reload the dashboard after each change. The exact menu labels can vary by WordPress version.
If you cannot reach the dashboard, use your hosting file manager or SFTP. Before changing anything, download a copy of the affected directory. Rename wp-content/plugins to something temporary such as plugins-disabled. This deactivates plugins without deleting their files. Try logging in again.
If that restores access, rename the directory back to plugins. WordPress will leave the plugins inactive. Reactivate them individually until the failure returns. The last plugin activated is a suspect, not automatically proof; confirm by deactivating it again and checking the dashboard.
Do not rename the entire wp-content directory because it also contains uploads and other site data. If disabling plugins changes nothing, a theme or must-use plugin may be involved. A hosting technician can check wp-content/mu-plugins and temporarily switch to a default theme, but theme changes can affect the live appearance and should be done carefully.
3. Look for the actual PHP error
A blank dashboard or HTTP 500 response often hides the useful explanation in a PHP error log. Check your hosting control panel’s error-log area, or ask the host for the PHP error generated at the time of the failed login. Log locations and labels vary by host.
You can enable WordPress debugging temporarily by editing wp-config.php, but this is an intermediate or advanced step. Back up the file first, place the settings before the line that says WordPress editing is complete, and avoid displaying errors to visitors:
define( 'WP_DEBUG', true );
define( 'WP_DEBUG_LOG', true );
define( 'WP_DEBUG_DISPLAY', false );
After reproducing the problem once, inspect wp-content/debug.log through SFTP or your file manager. Look for the first fatal error at the matching time and note the plugin, theme, PHP function, or file named there. Do not paste credentials or private site data into a public support forum.
Turn debugging off after collecting the information by restoring the previous values or setting them to false. Leaving logs and debugging enabled indefinitely can expose information and consume disk space. For official reference material, see the WordPress Documentation.
4. Inspect the browser console and failed requests
This step is particularly useful when the dashboard frame appears but widgets, menus, or editor controls never finish loading.
- Open the browser developer tools, usually with
F12or the browser menu. - Select the Console tab and reload the dashboard.
- Note red errors, especially references to a plugin, theme, blocked script, or mixed HTTP/HTTPS resource.
- Open the Network tab, reload, and look for failed requests returning 401, 403, 404, 500, or 503.
A failed request to /wp-json/ or another admin endpoint can indicate a firewall, authentication, REST API, PHP, or plugin problem. Avoid disabling a firewall permanently. If a security plugin or host firewall blocks a legitimate request, use its logs or ask the host to identify the rule and allow only the required request.
If you are seeing a REST API or JSON-specific error while editing rather than a dashboard failure, use the more targeted guide on the invalid JSON response error.
5. Check PHP version, memory, and server resources
A dashboard can fail when a plugin requires a different PHP version, PHP reaches its memory limit, or the server runs out of CPU, RAM, inodes, or disk space. These values are controlled by your host and may not be visible inside WordPress.
Check your hosting panel for PHP error logs, resource usage, disk space, and the active PHP version. Compare the failure time with resource graphs if available. Do not change PHP versions on production without a backup or staging test; an old plugin or theme may not support the target version.
You can see some environment details under Tools and Site Health when the dashboard is partly available. The exact labels vary by version. If the site reports loopback, REST, or scheduled-task failures, those may explain why dashboard components remain busy. For a deeper explanation of loopback causes, see how to fix WordPress loopback failures.
Do not raise memory limits repeatedly as a first response. A fatal plugin or theme error will remain even with more memory, and increasing limits may hide a leak until the server becomes unstable.
6. Verify database and file-system health
If the front end is slow or failing along with wp-admin, the database connection or storage may be involved. Check your host’s database status, disk space, and error logs. A failed database connection, crashed table, or full disk needs a backup and host-level investigation.
Do not run database repair or optimization commands on a live site without a current backup and a clear recovery plan. Avoid editing serialized WordPress options directly in a database tool; changing serialized data incorrectly can break URLs, settings, or plugin configuration.
Check file permissions only if the error indicates access problems. Incorrect ownership or permissions can prevent PHP from reading plugins and writing temporary files. Restore the host’s documented WordPress defaults rather than applying broad permissions such as 777.
7. Check security, CDN, and host restrictions
A security plugin, web application firewall, CDN, VPN, or host rule may allow the login page but block subsequent dashboard requests. Compare results from a trusted network and temporarily bypass only the relevant cache layer if your host or CDN documents how to do so.
Review firewall logs for the exact request and timestamp. Do not turn off every security layer at once on a live site. If the public site redirects, returns access errors, or shows unfamiliar content, stop repeated login attempts and investigate possible compromise. Use a dedicated hacked WordPress recovery guide when there are signs of malware.
Quick decision guide
- Works in a private window: clear site cookies or isolate a browser extension.
- Fails after a plugin update: deactivate plugins safely, then reactivate one at a time.
- Blank page or 500: inspect the PHP error log and temporary WordPress debug log.
- Spinner with console or network errors: identify the blocked request, JavaScript error, or firewall rule.
- Front end and dashboard both fail: check hosting, PHP, database, disk, and security logs.
- Only one user fails: test another administrator and review that account’s browser session or capabilities.
How to confirm the dashboard is fixed
After each change, use a private window to sign in and open the dashboard several times. Visit Plugins, Users, Settings, and the editor without saving unnecessary changes. Confirm that the public site, media library, scheduled tasks, and important forms still work.
Re-enable plugins one at a time if they were disabled. Keep the suspected plugin disabled until you have confirmed an update, configuration change, or replacement resolves the cause. Remove temporary debug settings, restore renamed directories, purge only the relevant cache, and document what changed.
Questions to ask when the problem continues
Why does login work but the dashboard does not?
Login is a separate request from the dashboard’s PHP rendering and background requests. A successful login does not rule out a fatal plugin, JavaScript failure, REST block, memory limit, or firewall rule.
Should I reinstall WordPress?
Usually not as a first step. Reinstalling core files will not fix a plugin conflict, database problem, blocked request, incompatible theme, or server resource limit. Identify the logged error before replacing files.
What if disabling plugins does not help?
Check must-use plugins, the active theme, PHP logs, browser network errors, hosting resources, and firewall logs. If the public site is also failing, involve the host before making database or server changes.
When should I stop troubleshooting myself?
Stop before editing the database, changing DNS, modifying server configuration, or changing .htaccess if you do not have a tested backup and rollback path. A production site with payment, membership, or customer data should be handled by the host or a qualified WordPress technician. WP Fix It’s WordPress Site Repair service is an option when access or diagnosis remains blocked.