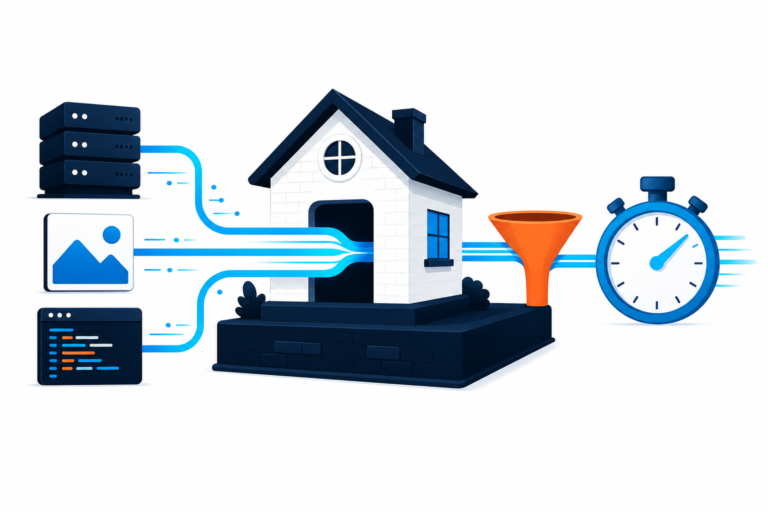


A WP Engine speed test is most useful when it measures the experience of a real visitor rather than a single uncached request from an arbitrary testing location. WP Engine uses caching and a content delivery network, so the same page can produce different results depending on the URL, device, location, cookies, and test settings.
In this guide
This guide explains how to test a WordPress site hosted on WP Engine without accidentally bypassing its cache or treating a lab score as a complete diagnosis. You will learn what to test, how to compare results, what common measurements mean, and which changes are safe to make first.
What a WP Engine speed test should tell you
A speed test should answer practical questions, not simply produce a grade. For example:
- How quickly does the first page become visible on a slower mobile connection?
- Is the server responding promptly, or is WordPress taking too long to generate the page?
- Are images, fonts, scripts, or styles delaying the main content?
- Does the page remain responsive while JavaScript loads?
- Does performance change significantly between visitors in different regions?
- Is the page slow only on the first request, or on repeated visits too?
No single tool measures every part of this experience. A browser-based lab test provides controlled conditions. Real-user data, when available, shows what visitors actually experience. Server and WordPress diagnostics help identify the cause.
Start with the official WordPress Documentation when you need to confirm a WordPress setting or understand how core features work. Hosting, theme, plugin, and CDN configuration should then be reviewed together rather than in isolation.
Before running a WP Engine speed test
Make the test repeatable before changing anything. Record the exact page URL, date, device type, testing location, and connection profile. A homepage, an article, and a WooCommerce product page may have completely different performance characteristics.
Choose representative URLs
Test at least three page types when possible:
- Homepage: This often contains a large hero image, sliders, recent posts, navigation elements, and marketing scripts.
- Content page: An article or service page reveals how text, images, embedded media, and related content affect loading.
- Conversion page: A product, checkout, booking, or contact page may use extra scripts that do not appear elsewhere.
Do not test only a lightweight page and assume the whole site is fast. Conversely, do not judge every page by the heaviest landing page.
Use the public URL
Use the canonical HTTPS address that visitors access. Avoid testing a WP Engine staging address when your goal is to measure the production site. Staging may have different caching, CDN, database content, traffic, and plugin settings.
Confirm that the page is publicly accessible. A login prompt, maintenance mode, firewall challenge, or password protection can cause a speed tool to measure an error page instead of WordPress.
Pause unnecessary variables
Do not edit plugins, theme files, cache settings, or image libraries while collecting baseline results. First capture several readings under the same conditions. Otherwise, you will not know whether a later change helped or whether the test itself varied.
How to run a reliable WP Engine speed test
You can use a browser-based performance tool such as Lighthouse or another reputable testing service. The exact labels vary, but the method is similar.
- Open the testing tool in a private browser window if the tool runs locally.
- Enter the public HTTPS URL, including the specific page you want to measure.
- Select mobile first. Mobile conditions usually expose large images, render-blocking resources, and excessive JavaScript more clearly.
- Use a consistent simulated location and connection profile for comparisons.
- Run the same page more than once and record the results.
- Repeat the process on desktop, then compare the opportunities rather than only the score.
The first request can differ from later requests because caches may be populated. That does not make either result automatically wrong. It means you need to label the result clearly as a first-view or repeat-view measurement.
Test both first-view and repeat-view behavior
A first-view test approximates a visitor who has not recently requested the page from that test environment. A repeat-view test approximates a visitor who may benefit from cached assets and an already established connection.
For a useful comparison, run a small sequence:
- One initial test after entering the URL.
- Several repeat tests without changing the page.
- The same sequence at another location if your audience is geographically distributed.
Large differences can point to caching, CDN routing, origin response time, or third-party services. They are clues, not proof of a single fault.
Do not add random cache-busting query strings
A URL such as ?test=12345 may be treated differently from the normal cached URL. It can create an artificially slow result or cause a page to bypass an optimization layer. Use the normal public URL unless you are specifically investigating query-string caching.
Understand the measurements that matter
Performance reports contain many numbers. Concentrate on the measurements that describe server response, visual loading, and interaction.
Time to First Byte
Time to First Byte, or TTFB, measures how long it takes before the browser receives the first response bytes. It includes network travel and server processing. A high value may involve origin processing, uncached page generation, database work, redirects, or a connection problem.

TTFB is not the same as total page load time. A page can begin responding quickly but still be slow because it downloads large images or executes extensive JavaScript. Conversely, a page with a modest amount of content may feel delayed if the initial response is late.
Largest Contentful Paint
Largest Contentful Paint, or LCP, estimates when the largest visible content element has rendered. On many pages, that element is a hero image, heading, poster image, or large text block.
When LCP is slow, inspect the element identified by the report. Common causes include an oversized image, a background image loaded late through CSS, a slow server response, render-blocking styles, or a client-side component that waits for JavaScript.
Cumulative Layout Shift
Cumulative Layout Shift, or CLS, measures unexpected movement during loading. A page can technically load quickly and still feel broken if buttons, images, or headings jump as resources arrive.
Reserve dimensions for images and embeds, avoid injecting banners above existing content, and check whether fonts cause text to reflow. Do not hide the symptom by freezing the entire page layout.
Interaction to Next Paint
Interaction to Next Paint, or INP, reflects how promptly the page responds after user interactions such as clicks, taps, or key presses. Heavy JavaScript, long tasks, sliders, analytics, chat tools, and page builders can all contribute.
A page may have a good initial visual score while still feeling unresponsive. Inspect long tasks and JavaScript execution when visitors report that menus, filters, or checkout controls lag.
Total Blocking Time
Total Blocking Time, or TBT, is a lab metric related to main-thread work. It helps identify periods when scripts prevent the browser from responding promptly. It is useful during controlled tests, but it is not a direct replacement for field interaction data.
Requests and transfer size
Count the number of requests and the amount of data downloaded, but do not optimize these numbers blindly. A small number of large requests can be worse than more small, efficiently cached requests. Identify which files are large, late, render-blocking, or loaded on pages where they are unnecessary.
Why WP Engine results can vary
Managed WordPress hosting does not make every page identical. Several layers can influence the result.
Page cache and CDN behavior
A cached HTML response can avoid repeated WordPress processing. Static assets may also be delivered from a nearby edge location. If a test reaches the origin or encounters a cache miss, the result may be slower than a repeat request.
Do not repeatedly purge the cache simply to obtain a better-looking test. A purge can make the next request a cold request and may temporarily remove useful cached content. Purge only when content or configuration genuinely requires it, and document what you changed.
Cookies and personalized content
Logged-in users, shopping carts, membership sessions, preview modes, and personalization can bypass or vary caching. Test in a clean visitor state when measuring public content. Test authenticated or cart behavior separately because those pages may correctly require dynamic processing.
Geographic distance
A visitor near the origin and a visitor far away do not experience the same network path. CDN delivery can reduce this difference for static files, but it cannot eliminate every network or origin factor.
Third-party services
Fonts, advertising, analytics, video players, chat widgets, consent tools, social feeds, and payment services can add requests outside your WordPress installation. A third party can delay the browser even when the WP Engine server responds efficiently.
Review the waterfall and identify the domains involved. Do not remove a service solely because it appears in a report; confirm its business purpose, loading behavior, and whether it is needed on every page.
How to read a waterfall report
A waterfall shows when each request starts, how long it takes, and whether requests wait on other resources. It is often more actionable than a single performance grade.
Look for these patterns
- Long initial delay: Investigate redirects, server response time, cache status, or slow origin processing.
- Large image near the top: Resize and compress the image, use an appropriate format, and ensure the main visual is not lazily loaded when it is immediately visible.
- Many blocking stylesheets: Review theme and plugin CSS, but avoid deleting styles without checking the page visually.
- Long JavaScript tasks: Identify the script or plugin responsible before using broad delay or defer settings.
- Third-party requests starting early: Ask whether they can load later or only on pages that need them.
- Repeated redirects: Correct the URL or HTTPS configuration. A speed test should begin at the final public URL.
Use the browser’s network panel for additional detail. The exact controls vary by browser, but you can usually inspect request initiators, response headers, transfer size, and timing.
Safe improvements to try first

Make one controlled change at a time, then rerun the same test sequence. Keep a simple record containing the page, change, test conditions, and results.
Optimize the page’s largest images
Choose dimensions appropriate for the display area rather than uploading a camera-original file and relying on the browser to shrink it. Use WordPress image sizes where possible, provide meaningful alternative text, and avoid loading several large images above the fold.
Do not lazy-load the primary visible image automatically. Lazy loading is generally useful for content below the initial viewport, but delaying the main visual can hurt the page’s visual loading measurement.
Remove unnecessary page-level assets
Some plugins load CSS and JavaScript on every page even when their feature is used only in one location. If a plugin provides a safe setting for selective loading, use that setting. Otherwise, make changes only after confirming that menus, forms, accessibility features, and tracking still work.
Review fonts
Limit font families and weights to those actually used. If fonts are hosted externally, consider whether the dependency is necessary and whether the loading strategy causes visible text changes. Always check headings, buttons, navigation, and multilingual content after font changes.
Reduce unnecessary third-party work
Load chat, video, social feeds, and analytics according to their purpose. A video player might load after a visitor clicks a placeholder. A support widget may not need to initialize on a checkout page. Follow consent requirements when changing tracking behavior.
Keep WordPress and extensions maintained
Updates may improve compatibility, security, and performance, but an update can also change page output. Create or confirm a backup, update through a safe workflow, and verify critical pages afterward. Performance work should not trade away security or functionality.
Common mistakes that make test results misleading
Chasing a score instead of a visitor problem
A perfect score is not the goal. A page with an acceptable lab score may still frustrate visitors because a key form fails, a product filter is slow, or a cookie banner blocks the screen. Prioritize visible and business-critical problems.
Testing only desktop
Desktop hardware and connections can hide excessive JavaScript and oversized assets. Use mobile testing as an important baseline, then confirm that desktop layouts remain correct.
Purging every cache repeatedly
Frequent purges make comparisons harder and can temporarily increase origin work. Test normal visitor behavior first. If you need to investigate cache status, record the cache action and treat the result as a separate diagnostic case.
Installing several optimization plugins
Multiple plugins may duplicate minification, lazy loading, script delay, image processing, or cache behavior. The result can be slower pages, broken interactions, or difficult troubleshooting. Change one layer at a time and keep a rollback path.
Delaying every script
Broad JavaScript delay can break navigation, consent handling, forms, carts, payment controls, and accessibility functions. Exclude essential scripts based on observed behavior rather than copying a generic exclusion list.
When a slow result points beyond the page
If several lightweight pages show a consistently high initial response time, investigate the server-side path rather than compressing more images. Possible areas include redirects, uncached processing, database queries, external API calls, plugin hooks, scheduled tasks, or a resource limit.
If only one page is slow, compare its content and functionality with a simple page. A page-specific template, query, shortcode, form, or builder element may be responsible.
If results vary sharply by location, compare CDN behavior, DNS, cache headers, and the geographic distribution of visitors. If results vary by login state, compare public and authenticated requests separately.
For a broader diagnostic process, you may also review our guide to WordPress speed and performance. If the site is already unstable or several changes have been layered together, a professional WordPress site repair review can be safer than experimenting on production.
A practical testing checklist
- Choose a public HTTPS URL and record the page type.
- Confirm the page is not in maintenance, preview, or logged-in mode.
- Run consistent mobile tests from the same location.
- Repeat the test and label first-view and repeat-view results.
- Run a desktop comparison.
- Record TTFB, LCP, CLS, INP or TBT, page weight, and notable waterfall requests.
- Identify the largest visible element and the longest blocking tasks.
- Change one thing at a time.
- Verify forms, menus, media, checkout, tracking, and accessibility after each change.
- Keep the baseline and rollback information before deploying further changes.
What a good result looks like
A useful outcome is not merely a higher number in a testing tool. You should understand which page is slow, under which conditions, and why. Visitors should see the primary content promptly, experience minimal layout movement, and be able to interact with important controls without avoidable delay.
Use several readings instead of one dramatic result. Compare like with like, preserve working functionality, and treat cache behavior as part of the real hosting environment. That approach turns a WP Engine speed test into a repeatable diagnostic process rather than a score-chasing exercise.